
 Auto-summarized by WETEC AI
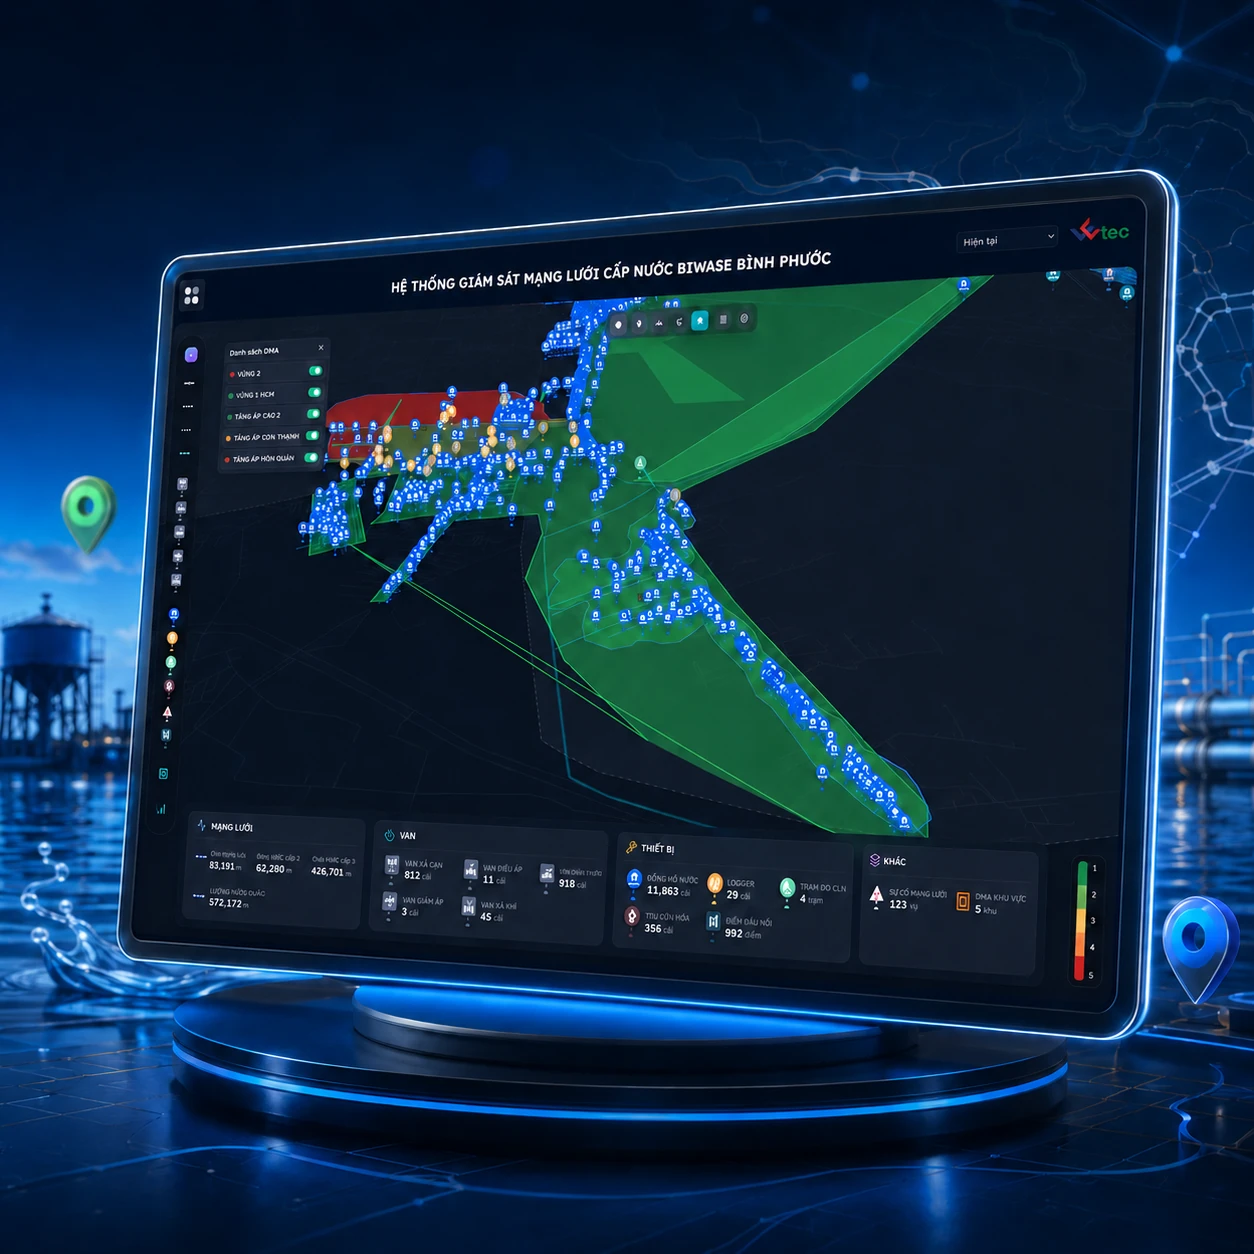
WETEC worked with BIWASE Binh Phuoc and partners to move network information from a locally run geographic information system (GIS) to web and mobile access. The digital map organizes more than 100,000 pipes, valves, meters, and district metered areas, connecting asset records with logger, smart meter, pressure, flow, and water-quality data. The system uses artificial intelligence to detect anomalies, helping teams compare measurements with nearby network assets and identify areas for inspection. Field crews can find locations, review and update asset condition records on mobile devices, supporting incident localization, asset management, and water-loss reduction work.
Illustration. Asset locations, records and field inspections connected.
Map 100,000+ network assets on GIS and connect sensor data to review anomalies and reduce water loss.
Organization: BIWASE Binh Phuoc and partners.
Taking network information from the office into the field
A geographic information system, or GIS, associates asset records with map locations. Utility teams need to see pipes and valves alongside meters and related district metered areas, or DMAs: network zones used to monitor flow and water loss. An office-only GIS makes it difficult to consult or update records on site. Scattered information also requires extra work to compare asset records with pressure and flow measurements.
Challenges to address
GIS ran locally, making remote and mobile access difficult.
Data was scattered, manual and inconsistent across internal systems.
The interface was hard to use and missing key operating functions.
What WETEC delivered
WETEC moved network information onto web and mobile GIS. Pipes, valves, meters and DMAs are organized on a digital map, with logger and sensor data connected to support anomaly detection.
Build GIS as the central data layer for devices, pipes, DMAs, loss management and incidents.
Integrate data from loggers, smart meters and water-quality monitoring, with AI detecting anomalies automatically.
How the workflow connects
Review measurements. Check pressure and flow measurements in the context of the associated DMA.
Narrow the area. Look up pipes, valves and assets near an unusual measurement.
Inspect on site. Field staff use their phones to find locations and review asset records.
Update records. Add inspection information so field and office teams can use it.
Physical assets connected to their digital records
The map helps teams find assets before an inspection. A datalogger records measurements such as pressure or flow. Connecting those points with network records helps operators compare measurements with nearby pipes and valves to identify an area for inspection.
Delivery outcomes
More than 100,000 network assets have been digitized. Teams can use web and mobile access, compare measurements to help locate incidents and update records after field inspections. These records support asset management and water-loss reduction work.
Over 100,000 water distribution network assets mapped and fully digitized.
Connected pressure and flow data to support incident localization.
Enabled field crews to query, inspect and update asset condition data directly on mobile.

Ready to modernize your water utility operations?
WETEC engineers are ready to survey, advise on DMA zoning, GIS digitization, and tailored non-revenue water mitigation strategies.