
The water data cycle and AI models

AI that flags incidents early and forecasts water demand

Spot leaks and faults from pressure and flow readings. Forecast how much water you need by hour and by day.

Anomaly alerts

Know about incidents before customers call

DMA-01
Illustrative readings. At 02:10, flow reaches 108 m³/h, outside the expected 58 - 82 m³/h.m³/h5010015020000:0006:0012:0018:0024:00Forecast
ReadingsExpectedNormal range
Alert · 02:10

Night flow spike

Reading
108 m³/h
Expected
58 - 82 m³/h

Sent to the on-duty engineer

  • A normal range for every hour

    Readings are compared with each meter’s own pattern, not a fixed threshold.

  • Alerts as soon as readings drift

    Pressure drops and rising night flow trigger an alert as they happen.

  • Sent with the location

    Alerts reach the responsible person’s phone with the meter and readings.

Narrow down incidents on the network

Compare inlet flow with branch pressure to know where to look first.

Flow up, pressure down
A sign of a leak or burst on that branch.
Several meters change together
Usually pump schedules, valve operations or area-wide demand.
Illustrative diagram: inlet flow rises, branch B pressure falls and branch A is stable. Branch B is marked for inspection.DMA inlet108 m³/h ↑Branch A3.4 bar · stableBranch B2.1 bar ↓Area to inspect
Inlet flow up, branch B pressure down: inspect branch B first.

Demand forecasting

Know how much water you will need

Hourly and daily forecasts for each area to plan production and pump schedules.

Tomorrow’s demand · DMA-01DMA-01
Illustrative forecast, peaking at 177 m³/h at 18:00.m³/h5010015020000:0006:0012:0018:0024:00
Expected peak18:00 · 177 m³/h

Benefits for your utility

Less water lost

Leaks are found sooner, so less water is lost.
Fewer false alarms

Alerts follow the forecast range, so operators trust them.

Planned production

Know demand ahead to adjust output, pump schedules and energy use.

Delivered project

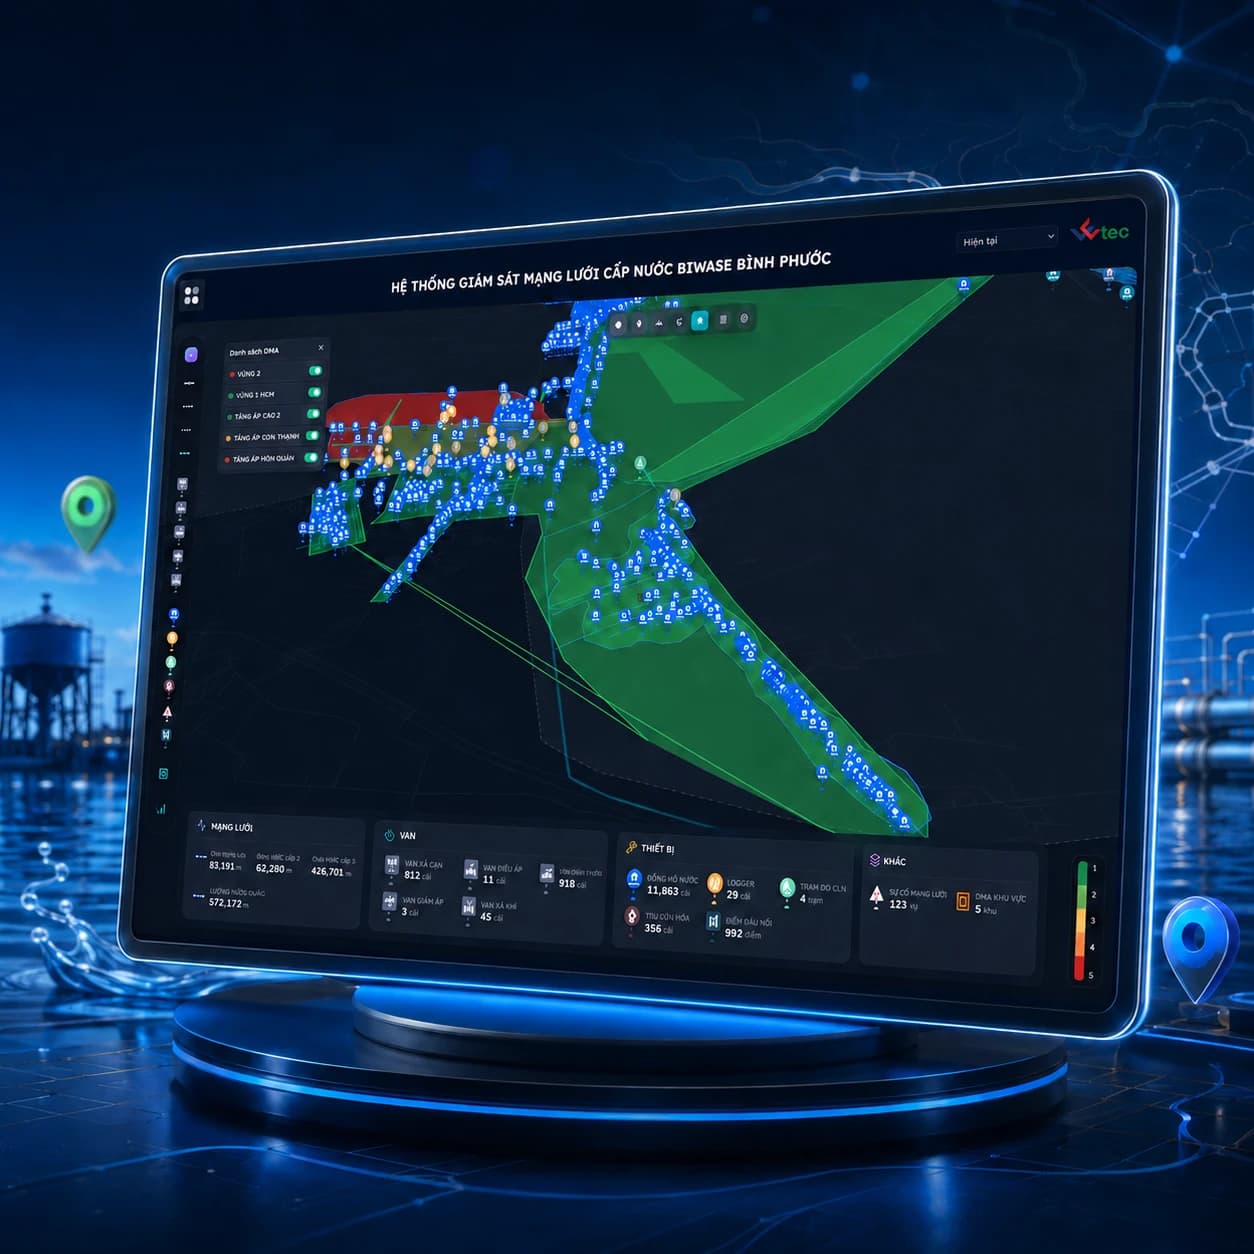
AI anomaly detection on the network

Logger, smart meter and water-quality data connected to AI to detect anomalies automatically, helping locate incidents and reduce water loss.
  • Anomaly alerts
  • Faster leak location
View the project
Network asset management on GIS

See AI working on your own readings

Work with WETEC to pick meters, review historical data and trial alerts and forecasts.

Book a demo