


See your whole network, cut water loss
Pipes, valves, meters, output and water quality on one digital map. AI flags anomalies so leaks are located early.
A digital network
All your network information on one map
No more paper drawings, scattered CAD files or each crew’s own logbook. Every pipe section, valve and meter has its location, records and measurements attached, and the office and the field look at the same source.
Maps and assets
Incident response
Find leaks faster
- 1
Get the alert
Unusual pressure or flow is flagged right on the map, together with the affected DMA and the measuring point that raised it.
- 2
Narrow it down
Check pipes, valves and incident history within the DMA to pinpoint the suspect pipe section and the area to inspect.
- 3
Fix and update
Field crews update the record on their phones as soon as the job is done, so network records stay current.
Live monitoring
Live operating data on the map
- Flow and pressure
Data logger and SCADA readings are updated on the map in real time.
- AI anomaly detection
AI gives early warning of leaks and incidents at each measurement point.
- Open system
Connects IoT devices, water-quality sensors and in-house software.
The value
Benefits for every team
- Management
- See network status and water loss for each DMA in one place, as a sound basis for investment and renewal decisions.
- Engineering
- Central asset management and faster incident location, so customers are without water for less time.
- Field staff
- Look up and update records on site, with no trips back to the office to check drawings and logbooks.
In practice
A delivered project
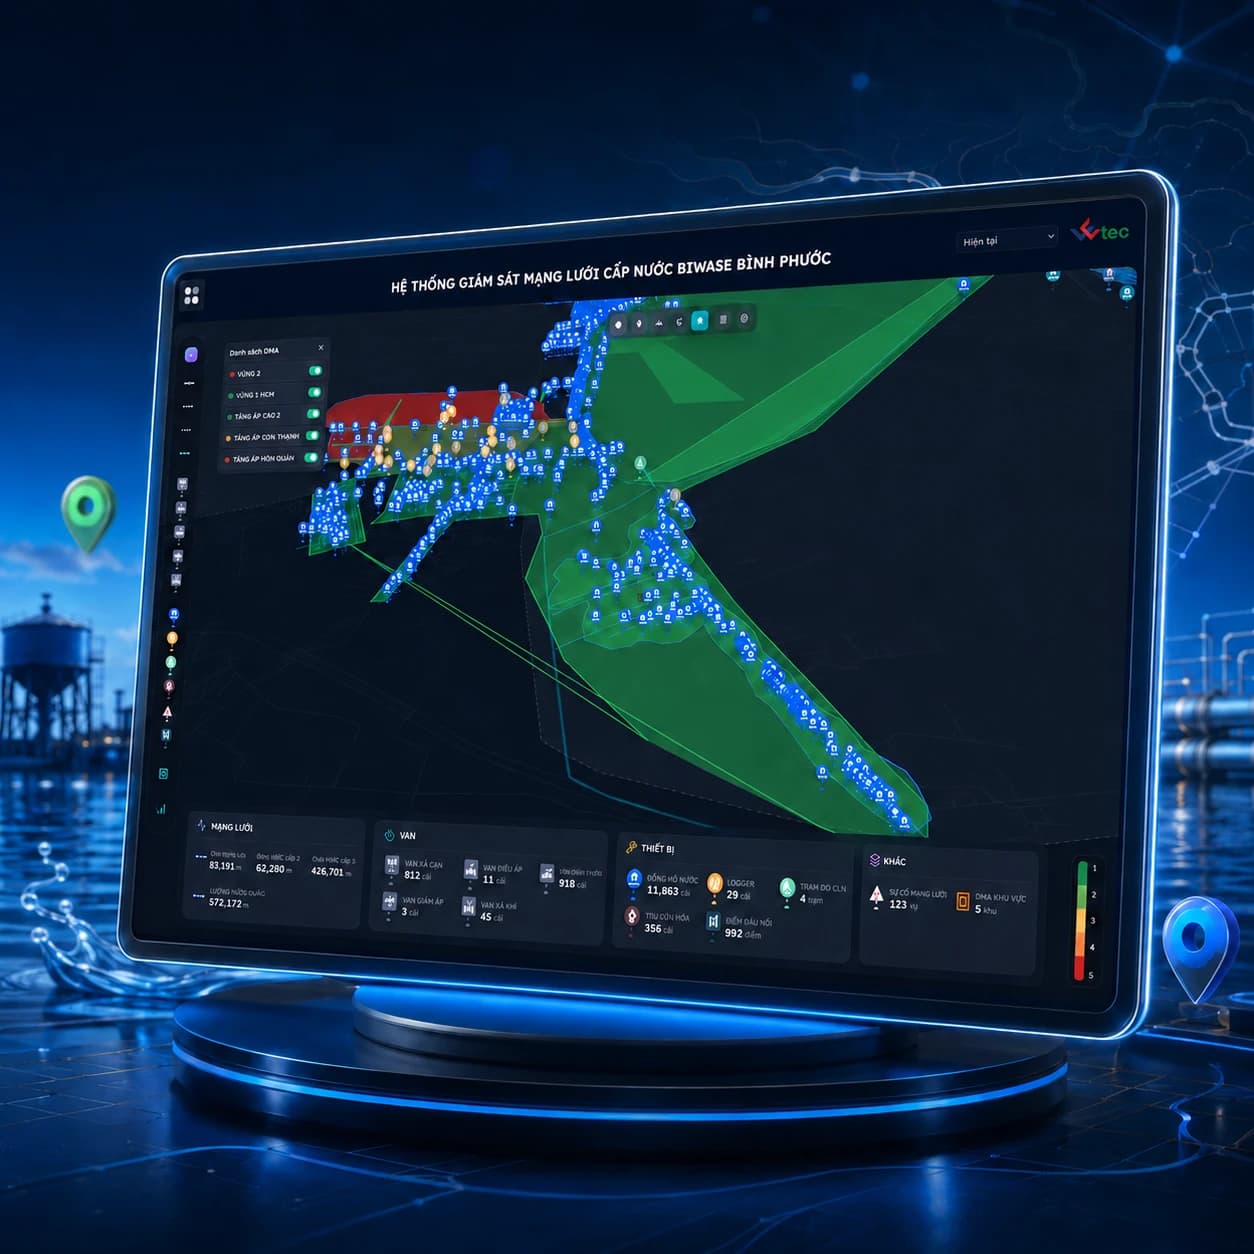
Network asset management on GIS
Digitised network assets and DMAs onto a digital map, connected to IoT sensor data to detect anomalies and cut water loss.
- AI anomaly alerts
- Web and mobile app
- Real-time data

See the network map in action
Book a session to see your network data on a digital map and how AI helps narrow down water loss.